
Unbound and Uncharted - Therapeutic Drug Monitoring of Free Valproic Acid in ICU Patients
I'm sorry to break this to you, but your ICU patient’s valproate
(VPA) level may be lying to you. Hidden within the total valproate
concentration you checked is the concentration that matters – the free
concentration, which is pharmacologically active and primarily responsible for
the CNS exposure to VPA1,2 – but without peeking under
the hood and directly measuring that free concentration, it is nearly
impossible to predict exactly how much VPA your patient is exposed to. Because
of this, dose adjustments made based on total concentrations have the risk of
widely missing the mark. While altered protein binding with valproic acid is a
well-known phenomenon especially in the setting of drug interactions like co-therapy
with phenytoin, the extent to which protein binding can be altered in ICU
patients is criminally underrecognized. Here we'll talk a bit about how VPA’s
pharmacokinetics are unique, what factors influence its binding to albumin, why
those factors matter in the ICU, and what to do about it.
January 15th, 2024 Update - Check out the interactive Fraser Free VPA Estimation Calculator here!
As a side note – my literature search for this post turned up way more articles than I was expecting. Not all of them were particularly relevant and not all could be included, but if you would like the list of the 191 articles I found for this post, you can find them here.
|
Key Points
|
Illustrative Case
A 65-year-old woman is admitted to the NeuroICU for status
epilepticus. She has a past medical history of depression and a prior TBI complicated
by post-traumatic epilepsy which had been controlled by levetiracetam. In the
ED, she received lorazepam IV 4mg, levetiracetam IV 4500mg followed by 1500mg
q12, and is ultimately intubated for airway protection and started on propofol for
seizure control and vent tolerance. As the propofol is weaned the following
day, she develops epileptiform discharges on EEG and is loaded with valproic
acid IV 3000 mg. Her post-load valproic acid level was 91.4 mg/L and she started
on 500 mg IV q8 (~20 mg/kg/day), experienced good response on EEG, and propofol
was weaned off and vent weaning began. The following day, despite propofol
being off and no seizure activity being captured on EEG, the patient’s mental
status remained poor. Her total valproic acid level was 52 mg/L, ammonia was 18 umol/L, and her LFTs were notable for an albumin of 2.9 g/dL. Presuming she
post-ictal and just needed time, she extubation was deferred. The following
day, her mental status remained poor, but her free valproic acid concentration
resulted from the reference laboratory at 32 mg/L, suggesting a toxic exposure
to valproic acid. Her valproic acid dose was decreased and the following day
the patient’s mental status began to improve and she was extubated later that
day.
This case, which is informed by my practice (the details
have been altered), is more common than we may think. Similar stories of
discordant total and free levels are well-described in the literature3–5 and problems with protein
binding, especially in patients with hepatic and renal impairment, were reported
before it was even approved in the United States.6,7 Despite its unpredictable
inter- and intraindividual pharmacokinetics, total concentrations remain the
standard method of monitoring which can lead to situations like the one above
in vulnerable populations.
Free Valproic Acid in Critically Ill Patients
How big of a deal is this discordance in ICU patients, you
might ask? You would not be the first – multiple
authors have evaluated discordance in measured VPA concentrations, and the
effect is most profound in the critically ill. Discordance is defined as a
difference in the interpretation of the free and total VPA level, which could
mean a therapeutic total VPA but supratherapeutic free VPA, subtherapeutic
total VPA but therapeutic free VPA, and so on. Discordance ranges from 29.7% to
87%, and the results are summarized below. Notably, while Gibbs et al reported hypoalbuminemia
as a major driver of discordance in their general inpatient population,
hypoalbuminemia has not seemed to explain the substantial discordance in other
cohorts.
|
Author |
Sample Size |
Therapeutic Free VPA |
Discordance % |
|
Gibbs8 |
219 inpatients, 41 outpatients |
4.8-17.3 mcg/mL |
Inpatient: 63% Outpatient: 19% |
|
Riker9 |
15 critically ill patients |
5-17 mcg/mL |
87% |
|
Fisch10 |
104 patients in status epilepticus |
5-10 mcg/mL |
29.7% |
|
Wallenburg11 |
132 inpatients, 10% from ICUs |
4-12 mcg/mL |
32% |
|
Drisaldi12 |
174 patients, 59.8% on the floor and 28.8% in the ICU |
7-23 mcg/mL |
43.1% (50% of ICU patients had discordance of >20%
from expected free) |
|
Brown13 |
256 critically ill patients |
5-15 mcg/mL |
70% |
While differences in population and defined therapeutic
ranges may explain the variation in discordance, the common conclusion is that
discordance is common in ICU patients, and much of the discordance is driven by
supratherapeutic free VPA levels even in the setting of subtherapeutic total
VPA levels. Why might this be? Let’s dive in to what is unique about VPA and
factors that may drive its maddeningly variable protein binding.
Valproic Acid
VPA is truly a medication with a can-do attitude. Good for seizures, status epilepticus, agitation, migraine, bipolar depression, and more, it can wear many hats in and out of the ICU. While versatile, it of course comes with its share of problems – multiple black box warnings (hepatotoxicity, risk in mitochondrial disease, teratogenicity, and pancreatitis) are only the start of the lengthy list of its potential adverse events which range from reasonably mild ADRs like weight gain and GI distress to fulminant hyperammonemic encephalopathy and severe thrombocytopenia. Paired with this is widely variable inter- and intraindividual pharmacokinetics and a narrow therapeutic index, and thus therapeutic drug monitoring is essentially mandated in all patients except for low dose use in low-risk patients.
VPA Pharmacokinetics – The Basics
If you’ve ever tried to look up the pharmacokinetics of VPA
on a tertiary resource, you’ve likely noticed something – for each parameter, range
of the provided value is quite wide. Absorption ranges from 80-100%, time to
peak absorption ranges from 4 to 17 hours, volume of distribution ranges from
10-90 L, and half-life ranges from 9 to 19 hours. The factors contributing to
this are numerous, including dosage form, age, body weight, food intake, the
time the sample is taken, and how the actual PK models are built.14 Protein binding in particular,
however, is the most variable at all – the reported range is often 10-20%, but its
nonlinear, concentration dependent behavior influenced by a laundry list of
factors make this far more complex. The relationship between total VPA and free
VPA as well as total VPA and free fraction has been assessed in numerous populations
using different dosage forms of VPA, methods of estimating free concentrations,
and at various time points and no two studies seems to report the same
relationship. The correlation between total VPA and free fraction has been
estimated to be linear,15 exponential,16 or just plain poorly
correlated,17 with the relationship between
total VPA and measured free VPA following a similar pattern.18–21 One concept remains true –
VPA protein binding is a saturable process. As total VPA concentrations
increase, the percent of that concentration that is unbound increases, leading
free VPA concentrations to behave in a nonlinear fashion. The difference in
relationship between total VPA and free VPA and free VPA percent is nicely
depicted here:17

Numerous attempts have been made to derive equations to
accurately predict this behavior, but few have made it to a successful external
validation, and all suffer from large magnitude estimation errors (a sample of relevant studies are listed below).12,15,18,22–31
|
Author |
Population/N |
Equation |
Correlation |
Notes |
|
Otten15 |
6 pediatric-young adult outpatient epilepsy patients |
%free = 0.12 * total VPA + 2.18 |
r = 0.81 |
Simple linear regression. Up to 81% error noted in one
patient |
|
Kodama18 |
9 healthy volunteers |
Free VPA (umol/L) = ½ * (total VPA – 757 – 1/0.0281 + ((757
– total VPA + 1/0.0281)2 + 4*total VPA/0.0281)1/2) |
Not reported |
Derived from mathematical models of protein binding. 1
umol/L VPA = 7 mg/L |
|
Kodama22 |
7 healthy volunteers |
Free VPA (umol/L) = ½ * (total VPA – 757 – 1/0.0281 + ((757
– total VPA + 1/0.0281)2 + 4*total VPA/0.0281)1/2) |
r = 0.865 |
Loses accuracy at total VPA levels above 85 mg/L |
|
Kodama23 |
23 pediatric outpatients with epilepsy |
Free VPA (umol/L) = ½ * (total VPA – 757 – 1/0.0281 + ((757
– total VPA + 1/0.0281)2 + 4*total VPA/0.0281)1/2) |
r = 0.872 |
Tended to underestimate free VPA; lost accuracy at VPA
levels above 80 mg/L |
|
Hermida24 |
53 adult patients on VPA |
%free = 130.69 *e-0.00496*albumin (umol/L) |
r = -0.82 |
Up to 12.5 mg/mL prediction error when total VPA was
greater than 60 mg/L. Equation from Parent et al.32 |
|
Fisch10 |
106 patients with status epilepticus |
%free = 130.69 *e-0.00496*albumin (umol/L) |
r not reported, but β 1.1 |
fVPA overestimated the measured is 30.4% of cases |
|
Nasreddine28 |
902 outpatients with epilepsy enrolled in VPA trial |
Free VPA (mg/L) = (0.0016*total VPA) + (0.012*total VPA)
+ 0.4134 |
R2 = 0.88 |
Albumin not available to include in model. |
|
Dore |
41 inpatients and outpatients on VPA |
Free VPA (umol/L) = 103.667 + 0.362*total VPA - 4.538*Albumin
(g/L) |
R2 = 0.855 |
Mean absolute prediction error of 3.4 mcg/mL; ICU
patients not included |
|
Giner30 |
33 patients admitted to a tertiary hospital |
Free VPA = 11.882 + 0.216*total VPA – 4.722*albumin |
R2 = 0.637 |
Prediction error ranged from -3.8 to 4.44 mg/L |
|
Ishikawa31 |
75 patients on VPA, 51.5% admitted to hospital but 0% in
ICU |
Free VPA (mcg/mL) = total VPA x 0.377 * e0.001*Albumin
(uM) |
r = 0.75 in an external data set |
Average error of 7.2 mcg/mL |
Protein Binding – More than Just Albumin
Let’s briefly discuss the theoretical basis of protein
binding. In school, I was taught protein binding largely as a binary concept – a
drug is either bound to a plasma protein (most commonly albumin) or it was not.
The reality is more complex, with plasma proteins acting as reservoirs of their
own receptors competing for a drug’s attention, and drugs have different levels
of affinity for different areas on protein. Drugs can bind to more than one
site as well, and can compete with other medications and other substances
within plasma for spots on the protein. This concept is outlined in a mathematical
level of detail frankly beyond my comprehension by George Scatchard in 194933 which laid the foundation for
the determination of medication protein binding behavior and in particular how
to calculate the number of binding sites and the affinity of a medication to
each binding site using what is called a Scatchard plot.
Early work with VPA
and its protein binding revealed that VPA has two main binding sites on albumin
with one predominating at therapeutic concentrations and the second becoming
more relevant in toxicity.7,34–36 A wide number of substances
and medications alter the strength of VPA’s affinity for those binding sites,
greatly affecting the proportion of drug that is unbound. Because of the
breadth of the competition, VPA’s protein binding is also easily saturable and
the proportion of unbound drug begins to increase at total concentrations as
low as 50 mg/L from 5% unbound at low concentrations to over 40% unbound at
concentrations above 150 mg/L.21 This was in outpatients with
epilepsy – the curve is even more extreme in the critically ill, with reports
of free fractions of 60-80% even at subtherapeutic total concentrations.13,37,38 This wide fluctuation in
protein binding then affects the intrinsic clearance of VPA, which is tightly
linked to free concentrations and thus varies depending on dose as total
concentrations increase, leading to nonlinear changes in serum concentrations
when doses are changed.39 A general rule of thumb is
that dose changes based on total concentration should change the total
concentration by 80% of the estimated linear change – for example, increasing a
total daily dose of VPA from 1,000mg to 1,500mg would be expected to increase
the total VPA concentration by 20%.
 |
| In this Scatchard plot, the affinity for VPA to its protein binding site is depicted on the Y axis and the number of albumin binding sites is depicted on the X axis. The affinity for albumin decreases as the concentration of phenytoin in solution increases (lines i-v) |
This sort of protein variability likely sounds familiar –
phenytoin is also heavily protein bound, dependent on albumin, can have altered
binding in critical illness, and discordance between the total and free
concentration of phenytoin is also common in critically ill patients.40 Luckily, a number of
correction equations for phenytoin protein binding exist to make interpretation
of total concentrations simpler, and equations specifically designed for
critically ill patients can improve the accuracy of estimates in ICU patients.41 The issue with VPA, however,
is every correction equation, even if well-performing on in-sample data, simply
fails to perform consistently in ICU patients. One study which evaluated the accuracy
of a free VPA correction equation in 104 patients with status epilepticus found
that estimates incorrectly estimated free VPA concentrations to be
subtherapeutic, therapeutic, or supratherapeutic 39.8% of the time. The
majority of mischaracterizations were overestimates, potentially putting
patients at risk of treatment failure.10
What Drives VPA Protein Binding?
For phenytoin, hypoalbuminemia, critical illness, and renal dysfunction
reliably predict altered protein binding and can be, with some confidence, used
to estimate free phenytoin concentrations in the absence of direct measurement.
What factors influence VPA’s altered protein binding, and why is estimation so
difficult? VPA is a branched short-chain fatty acid which behaves in much the
same way as other fatty acids when it comes to protein binding. This is
relevant, as free fatty acids are among the most common molecules bound to
albumin and changes nutrition, activity, or environment can significantly alter
the kinetics of free fatty acid protein binding and potential alter drug
protein binding.42 VPA likely binds to albumin
at the same site as organic fatty acids like oleic acid and palmitic acid, as
demonstrated by a linear increase in unbound VPA with increasing organic free
fatty acids in serum samples.36,43 VPA’s multiple metabolites
are all free fatty acid derivatives as well and are unmeasured in clinical
practice yet also contribute to VPA’s pharmacologic effect as well as net
protein binding.44 Here we will explore the many
factors at play to help you determine who is at the biggest risk of discordant
VPA concentrations.
Hepatic Dysfunction and Hypoalbuminemia
The impact of hepatic dysfunction on protein binding should
be evident due to lower levels of albumin in most patients with cirrhosis. This
was noted early in VPA’s use, with a study in 11 patients with cirrhosis
demonstrating a near 20% difference in protein binding compared to health
controls (free fraction of 29.3% in patients with alcoholic cirrhosis vs 11.3%
in healthy controls).45 Protein binding is directly
correlated with albumin concentration even in non-cirrhotic patients as well, with
an estimated 4-5% increase in free fraction with each 1 g/dL decrease in
albumin, although this relationship had low accuracy for patients with total
VPA concentrations above 80 mcg/mL.46 This relationship has been
confirmed multiple times in the hospitalized and ICU population, with multiple
reports of extreme changes in protein binding with worsening albumin
concentrations and at the population level each 1 g/dL decrease in albumin also
correlating with a 4.6% increase in free concentration, even after adjusting
for confounding.13,29,38,47,48
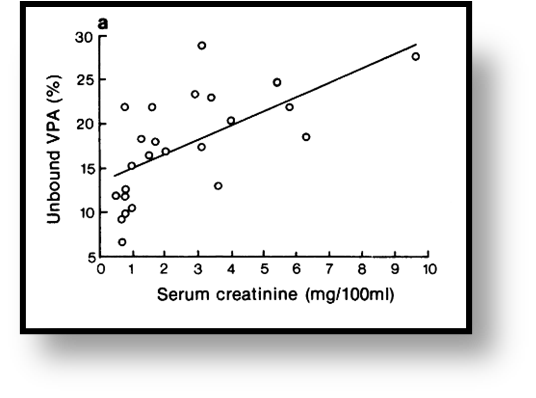
Renal Dysfunction
Phenytoin
 |
| The effect of VPA on PHT levels |
 |
| Estimated vs measured PHT on VPA co-therapy |
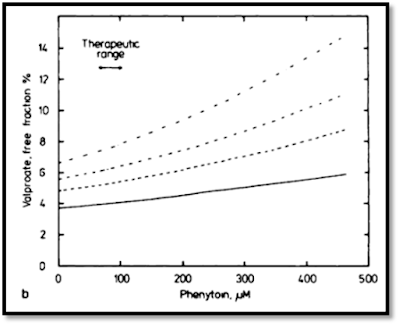
The effect of PHT on VPA is less pronounced – a similar
effect does occur at high phenytoin concentrations, leading to increases in
free VPA fraction. At therapeutic concentrations of phenytoin, however, the
effect is marginal, with only a limited impact on VPA protein binding.35 Regardless, whenever a
patient is initiated on each therapy together, especially in the ICU,
monitoring free concentrations of both medications is paramount. While the
effect of phenytoin on VPA is marginal under ideal circumstances, in critically
ill patients and in low albumin states, the effect can be pronounced, with an
increase in free VPA fraction from 24% at a total VPA level of 35 mcg/mL to
37.8% at 90 mcg/mL at a constant phenytoin concentration of 20 mcg/mL.21
 |
| The effect of PHT on VPA levels |
Free Fatty Acids
 |
| Increasing oleic acid is directly related to increasing free VPA |
While this may seem like it is only relevant to patients on TPN, a few key medications familiar to us in the ICU have high free fatty acid content which may carry a similar effect as Intralipid, namely propofol and clevidipine. Interestingly, Brown et al specifically evaluated receipt of propofol as a potential modulating factor in VPA protein binding and did not find that it was significantly associated with VPA protein binding after multivariable adjustment.13 Propofol exposure was a binary variable, however, and any exposure within 24 hours of the level being drawn was considered exposure, so this may not capture the nuanced and time-bound relationship between free fatty acid and VPA protein binding. Dose was also not considered, and it is likely that the extent of lipid exposure influences the effect on protein binding. Interestingly, VPA has also been shown to decrease propofol protein binding in vitro, however supraphysiologic VPA concentrations (1000 mg/L) were used to assess the response so it is questionable whether that is clinically relevant (protein binding was insignificantly changed at 100 mg/L except in hypoalbuminemic serum).57
As a side note, lipid administration has interestingly been
shown to be a potential therapy in ameliorating VPA-induced hyperammonemia,
apparently through inhibiting the kidney from producing ammonia.58
Aspirin and NSAIDs
Like free fatty acids, aspirin and NSAIDs and their
relationship to VPA protein binding was frequently published on in the 1980s
and 90s but do not seem to come up in clinical practice often. Case reports of
VPA toxicity due to even low-dose aspirin use appear sporadically in the
literature,4,59,60 but it does not flag in all
EMR systems (it doesn’t in mine, although you can find it in Lexicomp and
Micromedex). The same can be said about NSAIDs, with reports of both naproxen61 and ibuprofen62 supporting significantly
increased free VPA after initiation of NSAIDs. While less well-explored in the
in-vitro space, Fleitman et al did investigate the effects of several medications
on VPA albumin binding, including salicylic acid, and found that salicylic acid
more than doubled the VPA free fraction (15% to 35%) at a total VPA
concentration of 128.5 mcg/mL and increased the free fraction 15x (2% to 30%)
at a total VPA concentration of 40.2 mcg/mL.63 This has been confirmed in
multiple patient populations, including in the serum of patients with liver
disease,64 children,65 and renal failure, although
the interaction may be less significant in uremic plasma.66
Time Itself?
 |
| Variation in VPA levels during continuous infusion |
 |
| Example of differences in peaks and troughs between morning and evening doses of VPA |
 |
| Relationship between changes in free fatty acid concentrations throughout the day and changes in VPA protein binding throughout the day |
Clinical Implications
Naturally, the solution to this conundrum is to directly
measure the free VPA concentration in all critically ill patients. There are a
few problems with this approach, however – first and most obvious is that
measuring free valproic acid is technically challenging and requires experience
with ultrafiltration,75 is subject to large magnitude
measurement error if samples are handled incorrectly,76 and is a send-out laboratory
at many hospitals which impairs its ability to be used for real-time decision
making. Second, while the therapeutic range of 50-100 mg/L of total VPA is
reasonably well-established (worth noting that this range was determined
essentially by a good guess and has just sort of stuck since 1975 when Loiseau
et al said “The therapeutic range seems to 50-100 mg/L” in their discussion),77–81 the therapeutic range of free
VPA remains largely unknown. Different reference laboratories list different
normal ranges, from 5-25 mcg/mL at Mayo,82 4.8-17.3 mcg/mL at Quest,83 7-23 mcg/mL at ARUP,84 and 6-22 mcg/mL at Lab Corp.85
While the laboratories are not explicit in how these ranges
are derived, they are presumably from internal data on what the free concentrations
tend to be in patients with therapeutic total concentrations. The empirical
evidence does not provide much additional insight – only a handful of studies
have attempted to specifically quantify the relationship between free VPA and
therapeutic effect with inconsistent results given varying methods and patient
populations. Yu measured total and free VPA concentrations in 18 pediatric
patients with epilepsy and found an impressive free VPA range of 5-58 mcg/mL
although the relationship between free concentrations and seizure control was
not reported.19 Farrell et al attempted to establish
the relationship between both total and free VPA concentrations and seizure
control in 61 outpatient pediatric patients with epilepsy. Over 75% of patients
achieved seizure control in a surprisingly narrow free VPA range of 1.25-3.77
mcg/mL.86 Kilpatrick et al attempted to
correlate VPA concentrations and seizure control in a population of 70
outpatient adults with epilepsy and failed to detect a population-level
correlation with either total or free VPA but did find that at the individual
level, 75% of patients with changes in seizure frequency during the study
period had total levels that correlated with seizure changes and 67% had free
concentrations that correlated with response. The authors also used a free VPA
of 2.8-7.1 mcg/mL as the definition of therapeutic but do not explain where
this was derived from.87 The concept of
individual-level therapeutic ranges is also supported by Nakashima et al, who
used popPK methods to individually determine trough goals in 77 outpatients
with epilepsy.88 These data largely raise more
questions than they answer, and are effectively useless when considering the
use of VPA in the ICU population.
The other angle to
evaluate free VPA ranges from is toxicity, where there is some more concrete
evidence for how to best use the levels. Beyond anecdotal reports of altered
mental status with elevated free concentrations (free concentrations of 34.7
mcg/mL3 and 37.8 mcg/mL89 in two illustrative case
reports and as low as 15 mcg/mL5 in another), larger
population studies have also shown a correlation with free concentrations and several
key adverse events. Itoh et al assessed the association with VPA dose (mg/kg),
total VPA, and free VPA with the incidence of hyperammonemia and found free VPA
(slightly) outperformed dose and total VPA in terms of linear correlation with plasma
ammonia in 19 outpatients with epilepsy. CART analysis was used to identify
breakpoints for the incidence of hyperammonemia (plasma ammonia > 60
micromol/L) which supported a relatively low free VPA cutoff of 5.05 mcg/mL as
predictive of the adverse event.90 Brown et al also evaluated
the incidence of specific adverse events in relation to free VPA concentrations
in 256 critically ill patients on valproic acid. While stepwise increases in
free VPA were not significantly associated with increasing incidence of
hepatotoxicity, thrombocytopenia, or hyperammonemia, the model estimate favored
an increase risk of hyperammonemia when free VPA concentrations were above 15
mcg/mL (OR 1.91, 95% CI 0.81-4.49). While not found by Brown and colleagues,
Nasreddine et al also evaluated the relationship between free VPA and
thrombocytopenia in 264 patients who had enrolled in an outpatient valproic
acid monotherapy trial and revealed a linear relationship between free VPA and
platelet count, with a 9.8% increase in the odds of thrombocytopenia (platelet
count <100,000) per 1 mcg/mL increase in free VPA (OR 1.098, 95% CI
1.077-1.118). A breakpoint of 19.95 mcg/mL was determined from an ROC curve as
having 87% sensitivity and 81% specificity of predicting the incidence of
thrombocytopenia.91
 |
| Platelet count declines as free VPA trough increases |
What do I do with this information?
The bottom line here is VPA protein binding is highly
variable and often discordant in ICU patients. While it is not unusual for
protein binding characteristics of medications to be altered in critically ill
patients, the degree to which VPA’s kinetics vary between (and within) patients
is unusual. Despite being on the market for almost 50 years, there is still so
much to learn about VPA and what drives its unique pharmacokinetic properties.
Even its total therapeutic range of 50-100 mg/L was derived mostly from a good
guess and seizure response, especially in status epilepticus, has not
universally been associated with this range.92 Nevertheless, elevated VPA
levels, especially elevated free VPA levels, are strongly linked with increased
risk of serious toxicity and therapeutic drug monitoring is universal standard
of care for patients treated for seizures with VPA. In critically ill patients
especially, however, the free concentration of VPA does not follow expected
patterns and cannot be reliably predicted from total concentration alone and
should be directly measured in patients at risk for discordance. While an ideal
free VPA therapeutic range has not been clearly defined, aiming to keep free
VPA levels between 5-15 mg/L is likely prudent, and levels above 20-25 mg/L
should prompt dose reduction and evaluation for toxicity. Direct measurement of
free VPA requires specialized skills and equipment and thus is not readily available
at most institutions, but hopefully increased awareness of free VPA importance
and research on the clinical consequences of discordance will increase
availability of the test.

Clinical Pharmacist, Neurocritical Care
Massachusetts General Hospital
Ajwebb@mgh.harvard.edu
References
1. Rapeport W, Mendelow A, French G, et
al. Plasma protein-binding and CSF concentrations of valproic acid in man
following acute oral dosing. British Journal of Clinical Pharmacology.
1983;16(4):365-369. doi:10.1111/j.1365-2125.1983.tb02179.x
2. Wieser
HG. Comparison of valproate concentrations in human plasma, CSF and brain
tissue after administration of different formulations of valproate or
valpromide. Epilepsy Research. 1991;9(2):154-159.
doi:10.1016/0920-1211(91)90028-E
3. Smits
JEMP, Wallenburg E, Spanje A van, Luin M van, Marijnissen RM. Valproate
Intoxication in a Patient With Blood Valproate Levels Within Therapeutic Range.
J Clin Psychiatry. 2017;78(4):22075. doi:10.4088/JCP.15cr10147
4. de
Leon J, Kiesel JL, Fleming MW, Strobl B. Valproic Acid Toxicity Associated With
Low Dose of Aspirin and Low Total Valproic Acid Levels: A Case Report. Journal
of Clinical Psychopharmacology. 2009;29(5):509.
doi:10.1097/JCP.0b013e3181b4b07c
5. Mayerhoff
DI, Nurenberg J, Shah S, Schleifer SJ. Neurotoxicity Associated With Free
Valproic Acid. AJP. 2005;162(4):810-810. doi:10.1176/appi.ajp.162.4.810
6. Gugler
R, Schell A, Eichelbaum M, Fröscher W, Schulz HU. Disposition of valproic acid
in man. Eur J Clin Pharmacol. 1977;12(2):125-132. doi:10.1007/BF00645133
7. Gugler
R, Mueller G. Plasma protein binding of valproic acid in healthy subjects and
in patients with renal disease. British Journal of Clinical Pharmacology.
1978;5(5):441-446. doi:10.1111/j.1365-2125.1978.tb01652.x
8. Gibbs
HG, Zimmerman DE, Shermock KM, Clarke W, Mirski MA, Lewin JJ III. Comparison of
free fraction serum valproic acid concentrations between inpatients and
outpatients. American Journal of Health-System Pharmacy.
2015;72(2):121-126. doi:10.2146/ajhp140191
9. Riker
RR, Gagnon DJ, Hatton C, et al. Valproate Protein Binding Is Highly Variable in
ICU Patients and Not Predicted by Total Serum Concentrations: A Case Series and
Literature Review. Pharmacotherapy. 2017;37(4):500-508.
doi:10.1002/phar.1912
10. Fisch
U, Baumann SM, Semmlack S, Marsch S, Rüegg S, Sutter R. Accuracy of Calculated
Free Valproate Levels in Adult Patients With Status Epilepticus. Neurology.
2021;96(1):e102-e110. doi:10.1212/WNL.0000000000011000
11. Wallenburg
E, Klok B, de Jong K, et al. Monitoring Protein-Unbound Valproic Acid Serum
Concentrations in Clinical Practice. Therapeutic Drug Monitoring.
2017;39(3):269. doi:10.1097/FTD.0000000000000405
12. Drisaldi
A, Weeda E, Neyens R, et al. Accuracy of Valproic Acid Concentration Correction
Based on Serum Albumin. Neurocrit Care. 2019;30(2):301-306.
doi:10.1007/s12028-018-0627-4
13. Brown
CS, Liu J, Riker RR, et al. Evaluation of Free Valproate Concentration in
Critically Ill Patients. Critical Care Explorations. 2022;4(9):e0746.
doi:10.1097/CCE.0000000000000746
14. Methaneethorn
J. A systematic review of population pharmacokinetics of valproic acid. British
Journal of Clinical Pharmacology. 2018;84(5):816-834. doi:10.1111/bcp.13510
15. Otten
N, Hall K, Irvine-Meek J, Leroux M, Budnik D, Seshia S. Free Valproic Acid:
Steady-State Pharmacokinetics in Patients with Intractable Epilepsy. Canadian
Journal of Neurological Sciences. 1984;11(4):457-460.
doi:10.1017/S031716710004600X
16. Bellver
MJG, Sánchez MJG, Gonzalez ACA, Buelga DS, Dominguez–Gil A. Plasma protein
binding kinetics of valproic acid over a broad dosage range: therapeutic
implications. Journal of Clinical Pharmacy and Therapeutics.
1993;18(3):191-197. doi:10.1111/j.1365-2710.1993.tb00612.x
17. Dutta
S, Faught E, Limdi NA. Valproate protein binding following rapid intravenous
administration of high doses of valproic acid in patients with epilepsy. Journal
of Clinical Pharmacy and Therapeutics. 2007;32(4):365-371.
doi:10.1111/j.1365-2710.2007.00831.x
18. Kodama
Y, Tsutsumi K, Teraoka I, Fujii I, Takeyama M. Effect of Unbound Clearance on
Binding Parameters of Valproic Acid to Serum Proteins. The Journal of
Clinical Pharmacology. 1993;33(2):130-135.
doi:10.1002/j.1552-4604.1993.tb03932.x
19. Yu
HY. Clinical Implications of Serum Protein Binding in Epileptic Children During
Sodium Valproate Maintenance Therapy. Therapeutic Drug Monitoring.
1984;6(4):414. doi:10.1097/00007691-198412000-00006
20. Cloyd
JC, Dutta S, Cao G, Walch JK, Collins SD, Granneman GR. Valproate unbound
fraction and distribution volume following rapid infusions in patients with
epilepsy. Epilepsy Research. 2003;53(1):19-27.
doi:10.1016/S0920-1211(02)00251-6
21. Cramer
JA, Mattson RH. Valproic Acid: In Vitro Plasma Protein Binding and Interaction
with Phenytoin. Therapeutic Drug Monitoring. 1979;1(1):105.
doi:10.1097/00007691-197901000-00011
22. Kodama
Y, Kuranari M, Tsutsumi K, Kimoto H, Fujii I, Takeyama M. Prediction of Unbound
Serum Valproic Acid Concentration by Using In Vivo Binding Parameters. Therapeutic
Drug Monitoring. 1992;14(5):349. doi:10.1097/00007691-199210000-00001
23. Kodama
Y, Kuranari M, Kodama H, Ashikari Y, Fujii I, Takevama M. EVALUATION OF BINDING
EQUATION METHOD FOR UNBOUND SERUM CONCENTRATION PREDICTION OF VALPROIC ACID IN
POLYTHERAPY PEDIATRIC PA TIENTS WITH EPILEPSY. American Journal of
Therapeutics. 1995;2(2):106. doi:10.1097/00045391-199502000-00005
24. Hermida
J, Tutor JC. A Theoretical Method for Normalizing Total Serum Valproic Acid
Concentration in Hypoalbuminemic Patients. Journal of Pharmacological
Sciences. 2005;97(4):489-493. doi:10.1254/jphs.FPE04007X
25. Ueshima
S, Aiba T, Makita T, et al. Characterization of non-linear relationship between
total and unbound serum concentrations of valproic acid in epileptic children. Journal
of Clinical Pharmacy and Therapeutics. 2008;33(1):31-38.
doi:10.1111/j.1365-2710.2008.00885.x
26. Li Z,
Gao W, Liu G, Chen W. Prediction of Serum-Free and Cerebrospinal Fluid Valproic
Acid Levels in Patients With Hypoalbuminemia After Craniotomy. Therapeutic
Drug Monitoring. 2020;42(4):610. doi:10.1097/FTD.0000000000000749
27. Xu S,
Chen Y, Zhao M, Zhao L. Development of a Simple and Rapid Method to Measure
Free Fraction of Valproic Acid in Plasma Using Ultrafiltration and Ultra High
Performance Liquid Chromatography–Mass Spectroscopy: Application to Therapeutic
Drug Monitoring. Therapeutic Drug Monitoring. 2017;39(5):575.
doi:10.1097/FTD.0000000000000431
28. Nasreddine
W, Dirani M, Atweh S, Makki A, Beydoun A. Determinants of free serum valproate
concentration: A prospective study in patients on divalproex sodium
monotherapy. Seizure. 2018;59:24-27. doi:10.1016/j.seizure.2018.04.012
29. Doré
M, San Juan AE, Frenette AJ, Williamson D. Clinical Importance of Monitoring
Unbound Valproic Acid Concentration in Patients with Hypoalbuminemia. Pharmacotherapy:
The Journal of Human Pharmacology and Drug Therapy. 2017;37(8):900-907.
doi:10.1002/phar.1965
30. Giner
SC, Medall MDB, Piqueres RF. Design and validation of a predictive equation to
estimate unbound valproic acid concentration. Eur J Hosp Pharm.
Published online November 7, 2021. doi:10.1136/ejhpharm-2021-003092
31. Ishikawa
M, Uchida M, Asakawa T, et al. A novel method for predicting the unbound
valproic acid concentration. Drug Metabolism and Pharmacokinetics.
2023;50:100503. doi:10.1016/j.dmpk.2023.100503
32. Parent
X, Marzullo C, Gutbub AM. [Valproic acid: a simple method for the estimation of
free serum concentration]. Ann Biol Clin (Paris). 1993;51(6):649-650.
33. Scatchard
G. The Attractions of Proteins for Small Molecules and Ions. Annals of the
New York Academy of Sciences. 1949;51(4):660-672.
doi:10.1111/j.1749-6632.1949.tb27297.x
34. Kober
A, Olsson Y, Sjöholm I. Binding of Drugs to Human Serum Albumin: XIV. The
Theoretical Basis for the Interaction between Phenytoin and Valproate1. Mol
Pharmacol. 1980;18(2):237-242.
35. Monks
A, Boobis S, Wadsworth J, Richens A. Plasma protein binding interaction between
phenytoin and valproic acid in vitro. British Journal of Clinical
Pharmacology. 1978;6(6):487-492. doi:10.1111/j.1365-2125.1978.tb00871.x
36. Patel
IH, Levy RH. Valproic Acid Binding to Human Serum Albumin and Determination of
Free Fraction in the Presence of Anticonvulsants and Free Fatty Acids. Epilepsia.
1979;20(1):85-90. doi:10.1111/j.1528-1157.1979.tb04779.x
37. Hatton
C, Riker RR, Gagnon DJ, May T, Seder DB, Fraser GL. Free serum valproate
concentration more reliable than total concentration in critically ill
patients. Resuscitation. 2016;105:e15-e16.
doi:10.1016/j.resuscitation.2016.05.027
38. Maat
MM de, Leeuwen HJ van, Edelbroek PM. High Unbound Fraction of Valproic Acid in
a Hypoalbuminemic Critically III Patient on Renal Replacement Therapy. Ann
Pharmacother. 2011;45(3):420-420. doi:10.1345/aph.1P30a
39. Bowdle
TA, Patel IH, Levy RH, Wilensky AJ. Valproic acid dosage and plasma protein
binding and clearance. Clinical Pharmacology & Therapeutics.
1980;28(4):486-492. doi:10.1038/clpt.1980.192
40. Buckley
MS, Reeves BA, Barletta JF, Bikin DS. Correlation of Free and Total Phenytoin
Serum Concentrations in Critically Ill Patients. Ann Pharmacother.
2016;50(4):276-281. doi:10.1177/1060028015627468
41. Barra
ME, Phillips KM, Chung DY, Rosenthal ES. A Novel Correction Equation Avoids
High-Magnitude Errors in Interpreting Therapeutic Drug Monitoring of Phenytoin
Among Critically Ill Patients. Ther Drug Monit. 2020;42(4):617-625.
doi:10.1097/FTD.0000000000000739
42. Spector
AA, Santos EC, Ashbrook JD, Fletcher JE. Influence of Free Fatty Acid
Concentration on Drug Binding to Plasma Albumin*. Annals of the New York
Academy of Sciences. 1973;226(1):247-258.
doi:10.1111/j.1749-6632.1973.tb20486.x
43. Zimmerman
CL, Patel IH, Levy RH, Edwards D, Nelson SD, Hutchinson M. Protein Binding of
Valproic Acid in the Presence of Elevated Free Fatty Acids in Patient and
Normal Human Serum. Epilepsia. 1981;22(1):11-17.
doi:10.1111/j.1528-1157.1981.tb04328.x
44. Semmes
RLO, Shen DD. Nonlinear Binding of Valproic Acid (VPA) and E-Δ2-Valproic Acid
to Rat Plasma Proteins. Pharm Res. 1990;7(5):461-467.
doi:10.1023/A:1015804413818
45. Klotz
U, Rapp T, Müller WA. Disposition of valproic acid in patients with liver
disease. Eur J Clin Pharmacol. 1978;13(1):55-60. doi:10.1007/BF00606683
46. Sadahiro
N, Kodama S, Matsui T, Komatsu M, Matsuo T. Effect of serum albumin on free
fractions of phenobarbital and valproic acid in patients with convulsive
seizures. Brain and Development. 1985;7(4):377-384.
doi:10.1016/S0387-7604(85)80134-0
47. Lagneau
F, Perbet S, Delefosse D, Wernet A, Stocco J, Marty J. Drugs pharmacokinetics
in ICU patients: consequences of hypoalbuminemia upon drugs monitoring and
dosing scheme. Intensive Care Med. 2004;30(6):1247-1247.
doi:10.1007/s00134-004-2313-6
48. Haroldson
JA, Kramer LE, Wolff DL, Lake KD. Elevated Free Fractions of Valproic Acid in a
Heart Transplant Patient with Hypoalbuminemia. Ann Pharmacother.
2000;34(2):183-187. doi:10.1345/aph.19147
49. Dasgupta
A, Volk A. Displacement of Valproic Acid and Carbamazepine from Protein Binding
in Normal and Uremic Sera by Tolmetin, Ibuprofen, and Naproxen: Presence of
Inhibitor in Uremic Serum That Blocks Valproic Acid-Naproxen Interactions. Therapeutic
Drug Monitoring. 1996;18(3):284. doi:10.1097/00007691-199606000-00011
50. Clinical
and Pharmacological Aspects of Sodium Valproate (Epilim) in the Treatment of
Epilepsy: Proceedings of a Symposium Held at Nottingham University 23/24
September, 1975. MCS Consultants for Reckitt-Labaz; 1976.
51. Patsalos
PN, Lascelles PT. Valproate may lower serum-phenytoin. Lancet.
1977;1(8001):50-51. doi:10.1016/s0140-6736(77)91693-2
52. Perucca
E, Hebdige S, Frigo GM, Gatti G, Lecchini S, Crema A. Interaction between
phenytoin and valproic acid: Plasma protein binding and metabolic effects. Clinical
Pharmacology & Therapeutics. 1980;28(6):779-789.
doi:10.1038/clpt.1980.235
53. May
TW, Rambeck B, Nothbaum N. Nomogram for the Prediction of Unbound Phenytoin
Concentrations in Patients on a Combined Treatment of Phenytoin and Valproic
Acid. ENE. 1991;31(1):57-60. doi:10.1159/000116647
54. Bowdle
TA, Patel IH, Levy RH, Wilensky AJ. The influence of free fatty acids on
valproic acid plasma protein binding during fasting in normal humans. European
Journal of Clinical Pharmacology. 1982;23(4):343-347.
doi:10.1007/BF00613618
55. Albani
F, Riva R, Procaccianti G, Baruzzi A, Perucca E. Free Fraction of Valproic
Acid: In Vitro Time-Dependent Increase and Correlation with Free Fatty Acid
Concentration in Human Plasma and Serum. Epilepsia. 1983;24(1):65-73.
doi:10.1111/j.1528-1157.1983.tb04867.x
56. Vorum
H, Gram L, Honoré B. Valproate and palmitate binding to serum albumin in
valproate-treated patients. relation to obesity. Epilepsy Research. 1993;16(1):55-64.
doi:10.1016/0920-1211(93)90040-E
57. Ishii-Maruhama
M, Higuchi H, Nakanou M, et al. In vitro changes in the proportion of
protein-unbound-free propofol induced by valproate. J Anesth.
2018;32(5):688-693. doi:10.1007/s00540-018-2540-6
58. Warter
JM, Marescaux C, Hirsch E, et al. Decrease of valproate-induced hyperammonemia
in normal subjects by lipid ingestion. Journal of the Neurological Sciences.
1985;69(3):285-290. doi:10.1016/0022-510X(85)90140-6
59. Sandson
NB, Marcucci C, Bourke DL, Smith-Lamacchia R. An Interaction Between Aspirin
and Valproate: The Relevance of Plasma Protein Displacement Drug-Drug
Interactions. AJP. 2006;163(11):1891-1896.
doi:10.1176/ajp.2006.163.11.1891
60. Goulden
KJ, Dooley JM, Camfield PR, Fraser AD. Clinical valproate toxicity induced by
acetylsalicylic acid. Neurology. 1987;37(8):1392-1392.
doi:10.1212/WNL.37.8.1392
61. Grimaldi
R, Lecchini S, Crema F, Perucca E. In vivo plasma protein binding interaction
between valproic acid and naproxen. European Journal of Drug Metabolism and
Pharmacokinetics. 1984;9(4):359-363. doi:10.1007/BF03189686
62. Lana
F, Martí-Bonany J, Fuster J, de Leon J. Reduction in serum concentration of
valproic acid secondary to the intake of ibuprofen as an example of valproic
acid auto-induction metabolism. Actas Esp Psiquiatr. 2016;44(4):136-144.
63. Fleitman
JS, Bruni J, Perrin JH, Wilder BJ. Albumin-Binding Interactions of Sodium
Valproate. The Journal of Clinical Pharmacology. 1980;20(8-9):514-517.
doi:10.1002/j.1552-4604.1980.tb02544.x
64. Urien
S, Albengres E, Tillement JP. Serum protein binding of valproic acid in healthy
subjects and in patients with liver disease. Int J Clin Pharmacol Ther
Toxicol. 1981;19(7):319-325.
65. Orr
JM, Abbott FS, Farrell K, Ferguson S, Sheppard I, Godolphin W. Interaction
between valproic acid and aspirin in epileptic children: Serum protein binding
and metabolic effects. Clinical Pharmacology & Therapeutics.
1982;31(5):642-649. doi:10.1038/clpt.1982.89
66. Dasgupta
A, Jacques M. Reduced in vitro displacement of valproic acid from protein
binding by salicylate in uremic sera compared with normal sera. Role of uremic
compounds. Am J Clin Pathol. 1994;101(3):349-353.
67. Min
DI, Chen HY, Fabrega A, et al. CIRCADIAN VARIATION OF TACROLIMUS DISPOSITION IN
LIVER ALLOGRAFT RECIPIENTS1. Transplantation. 1996;62(8):1190.
doi:10.1097/00007890-199610270-00031
68. Loiseau
P, Cenraud B, Levy RH, et al. Diurnal Variations in Steady-state Plasma
Concentrations of Valproic Acid in Epileptic Patients. Clin Pharmacokinet.
1982;7(6):544-552. doi:10.2165/00003088-198207060-00004
69. Marty
J, Kilpatrick C, Moulds R. Intra-dose variation in plasma protein binding of
sodium valproate in epileptic patients. British Journal of Clinical
Pharmacology. 1982;14(3):399-404. doi:10.1111/j.1365-2125.1982.tb01998.x
70. Patel
IH, Venkataramanan R, Levy RH, Viswanathan CT, Ojemann LM. Diurnal Oscillations
in Plasma Protein Binding of Valproic Acid. Epilepsia.
1982;23(3):283-290. doi:10.1111/j.1528-1157.1982.tb06193.x
71. Patients
E, Riva R, Albani F, et al. Diurnal Fluctuations in Free and Total Plasma
Concentrations of Valproic Acid at Steady State in. Therapeutic Drug
Monitoring. 1983;5(2):191. doi:10.1097/00007691-198306000-00007
72. Bauer
LA, Davis R, Wilensky A, Raisys V, Levy RH. Valproic acid clearance: Unbound
fraction and diurnal variation in young and elderly adults. Clinical
Pharmacology & Therapeutics. 1985;37(6):697-700.
doi:10.1038/clpt.1985.116
73. Arens
TL, Pollack GM. Nonstationary disposition of valproic acid during prolonged
intravenous infusion: contributions of unbound clearance and protein binding. Biopharmaceutics
& Drug Disposition. 2001;22(6):243-249. doi:10.1002/bdd.259
74. Roman
E, Ponniah P, Lambert J, Buchanan N. Free sodium valproate monitoring. British
Journal of Clinical Pharmacology. 1982;13(3):452-455.
doi:10.1111/j.1365-2125.1982.tb01403.x
75. Wu X,
Li H, Dong W, et al. Determination of Free Valproic Acid Concentration in 569
Clinical Samples by LC-MS/MS After Hollow Fiber Centrifugal Ultrafiltration
Treatment. Ther Drug Monit. 2021;43(6):789-796.
doi:10.1097/FTD.0000000000000903
76. Wang
D, Champion-Lyons E, Neyens R, Bohm N, Caddell B, Babic N. The Effect of Sample
Handling on Free Valproic Acid Levels. The Journal of Applied Laboratory
Medicine. 2021;6(3):645-653. doi:10.1093/jalm/jfaa181
77. Loiseau
P, Brachet A, Henry P. Concentration of Dipropylacetate in Plasma. Epilepsia.
1975;16(4):609-615. doi:10.1111/j.1528-1157.1975.tb04743.x
78. Barnes
SE, Bower BD. Sodium Valproate in the Treatment of Intractable Childhood
Epilepsy. Developmental Medicine & Child Neurology.
1975;17(2):175-181. doi:10.1111/j.1469-8749.1975.tb03469.x
79. Gugler
R, von Unruh GE. Clinical Pharmacokinetics of Valproic Acid. Clin
Pharmacokinet. 1980;5(1):67-83. doi:10.2165/00003088-198005010-00002
80. Chadwick
DW. Concentration-Effect Relationships of Valproic Acid. Clin Pharmacokinet.
1985;10(2):155-163. doi:10.2165/00003088-198510020-00003
81. Beydoun
A, Sackellares JC, Shu V. Safety and Efficacy of Divalproex Sodium Monotherapy
in Partial Epilepsy: A Double-blind, Concentration-response Design Clinical
Trial. Neurology. 1997;48(1):182-188. doi:10.1212/WNL.48.1.182
82. VALPF
- Overview: Valproic Acid, Free, Serum. Accessed May 21, 2023.
https://www.mayocliniclabs.com/test-catalog/overview/37068#Clinical-and-Interpretive
83. Valproic
Acid, Free | Test Detail | Quest Diagnostics. Accessed May 21, 2023.
https://testdirectory.questdiagnostics.com/test/test-detail/3314/valproic-acid-free?p=r&q=Valproic%20Acid,%20Free&cc=MASTER
84. Valproic
Acid, Free and Total | ARUP Laboratories Test Directory. Accessed May 21, 2023.
https://ltd.aruplab.com/Tests/Pub/0099310
85. 070789:
Valproic Acid, Free, Serum or Plasma | Labcorp. Accessed May 21, 2023.
https://www.labcorp.com/tests/070789/valproic-acid-free-serum-or-plasma
86. Farrell
K, Abbott FS, Orr JM, Applegarth DA, Jan JE, Wong PK. Free and Total Serum
Valproate Concentrations: Their Relationship to Seizure Control, Liver Enzymes
and Plasma Ammonia in Children. Canadian Journal of Neurological Sciences.
1986;13(3):252-255. doi:10.1017/S0317167100036374
87. Kilpatrick
CJ, Bury RW, Fullinfaw RO, Moulds RF. Plasma concentrations of unbound
valproate and the management of epilepsy. Aust N Z J Med.
1987;17(6):574-579. doi:10.1111/j.1445-5994.1987.tb01259.x
88. Nakashima
H, Oniki K, Nishimura M, et al. Determination of the Optimal Concentration of
Valproic Acid in Patients with Epilepsy: A Population
Pharmacokinetic-Pharmacodynamic Analysis. PLOS ONE.
2015;10(10):e0141266. doi:10.1371/journal.pone.0141266
89. Dautzenberg
G, Nederlof M, Beekman A, Egberts T, Heerdink ER. Severe Cognitive Impairment
Associated With a High Free But Therapeutic Total Concentration of Valproic
Acid Due to Hypoalbuminemia in an Older Patient With Bipolar Disorder. Journal
of Clinical Psychopharmacology. 2018;38(3):265.
doi:10.1097/JCP.0000000000000872
90. Itoh
H, Suzuki Y, Fujisaki K, Sato Y, Takeyama M. Correlation between Plasma Ammonia
Level and Serum Trough Concentration of Free Valproic Acid in Patients with
Epilepsy. Biological and Pharmaceutical Bulletin. 2012;35(6):971-974.
doi:10.1248/bpb.35.971
91. Nasreddine
W, Atweh SF, Beydoun AA, Dirani M, Nawfal O, Beydoun A. Predicting the
occurrence of thrombocytopenia from free valproate levels: A prospective study.
Seizure. 2022;94:33-38. doi:10.1016/j.seizure.2021.11.018
92. Vijiala
S, André P, Buclin T, Decosterd LA, Rossetti AO, Novy J. Valproate in status
epilepticus: Correlation between loading dose, serum levels, and clinical
response. European Journal of Neurology. 2022;29(9):2607-2611.
doi:10.1111/ene.15441


Comments
Post a Comment